

Crime data is published openly, updated monthly and mapped for free, which makes it the easiest thing to look up and the easiest thing to misread. Almost everyone reads it the same wrong way: open the map, count the pins, decide.
A pin is not an address
Every report on police.uk is snapped to the nearest point from a fixed list of anonymised map locations. That point can sit some distance from where anything happened, which is the entire purpose — it protects victims and witnesses from being identified by their own front door appearing on a public map.
So a cluster on one corner does not mean that corner is dangerous. It usually means that corner is the anonymised point for everything reported in the streets around it. Reading a map at street level and drawing conclusions about individual roads is reading the anonymisation, not the crime.
Counts follow people, not danger
The second mistake is comparing a town centre with a suburb and concluding the centre is worse. A high street with shops, pubs, a station and tens of thousands of people passing through will record more shoplifting, more public order and more theft from the person than a residential estate ever will. That tells you it is busy.
If you want a fair comparison, compare places of similar character. Two residential areas. Two centres. And compare by category rather than by total, because an area with high shoplifting and low burglary is describing a retail district, not a risk to your home.
One month is weather, a year is climate
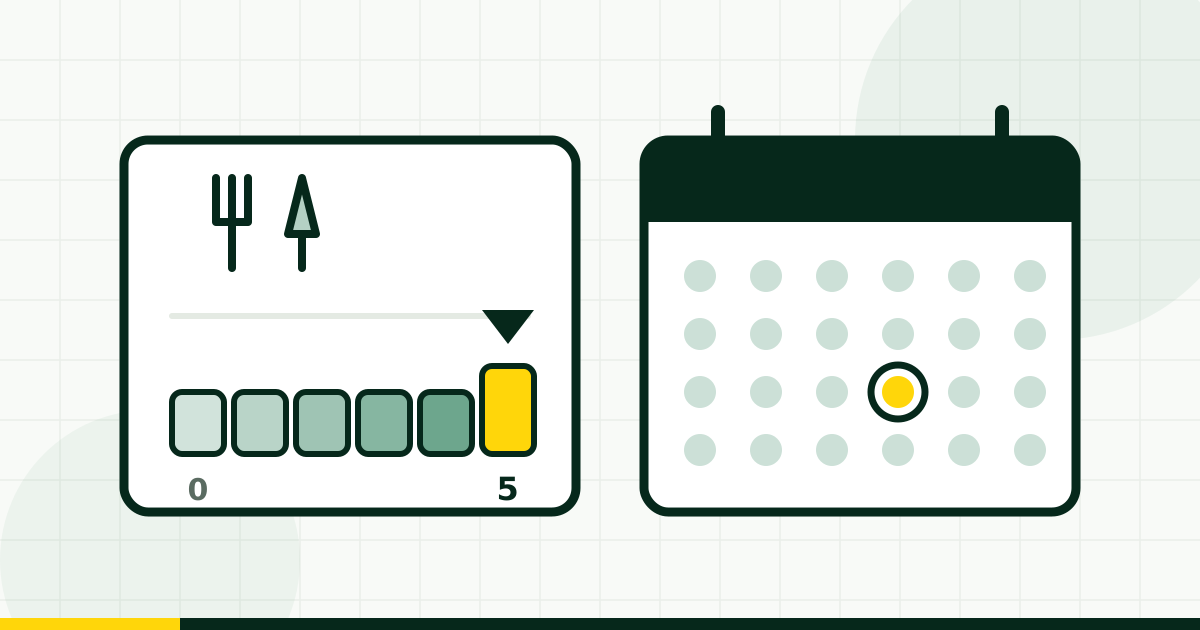
Monthly figures bounce. A single incident with several linked reports can double a small area's count for one month and nothing has changed about the place. Look at a full year, and look at whether the trend moves rather than where one month landed.
Our crime section shows a rolling twelve months within roughly a mile of a postcode, broken down by category, with the latest month we hold stated on the page. Across the areas we cover that is 2,152 area-month records.
What the data cannot tell you
Recorded crime is crime that was reported and recorded. Under-reporting varies by offence and by area, and a place where people have given up reporting looks quiet in the figures. The ONS Crime Survey exists precisely because recorded crime alone is an incomplete measure, and it consistently finds offences the police figures do not.
Nor does any of it capture the thing people actually mean when they ask whether an area is safe, which is usually how it feels to walk home at eleven at night. For that, walk home at eleven at night.
A fair comparison, in four steps
Pick two postcodes of similar character. Take a full year, not a month. Read the categories, not the total. Then go and stand in both places after dark on an ordinary weekday. The data narrows the list; it does not make the decision.


Comments
Loading…
Comments are open to members, so every one is attached to a real account.