
Every property search eventually reaches the crime map, and most people read it wrong. I have read it wrong. Here is what I wish I had understood earlier.
1. The pins are not addresses
This is the big one.
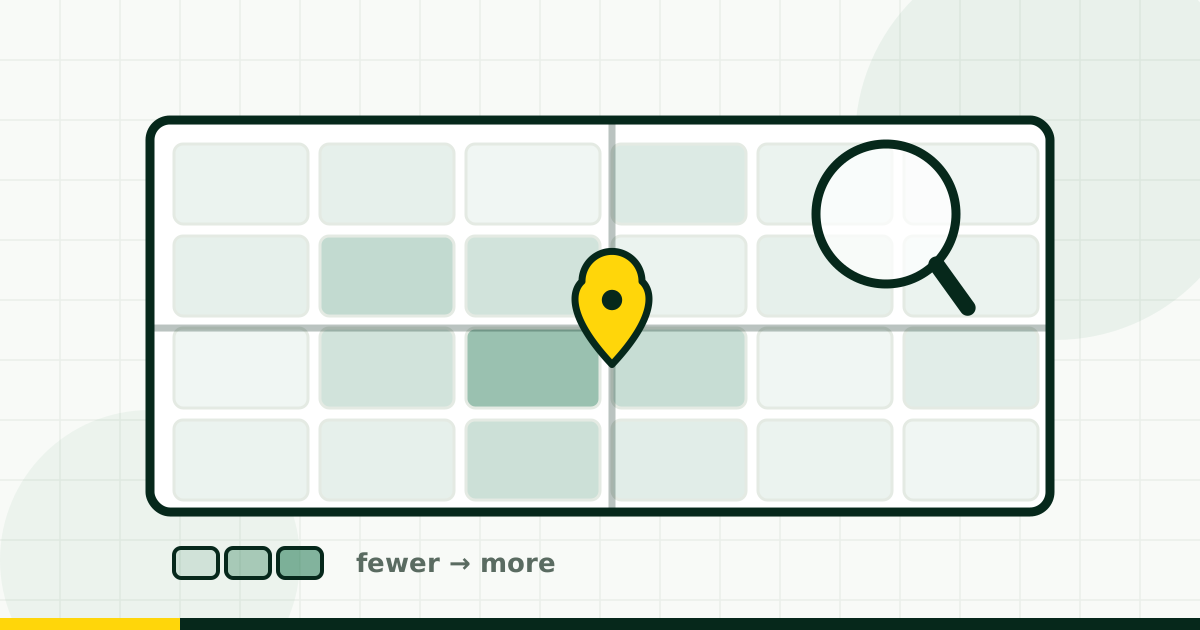
Police.uk anonymises the location of every recorded crime to a nearby representative point — a road junction, a shop front, a point in the middle of a street. The real location is deliberately obscured, for obvious reasons.
So when you see six incidents apparently stacked on one house, you are not looking at a problem house. You are looking at an anonymising point that several nearby incidents were assigned to. People have talked themselves out of homes over this.
2. Busy places record more crime, always
A postcode with a station, a high street and four pubs will record more incidents than a quiet residential road half a mile away. That is not a statement about danger; it is a statement about footfall. Shoplifting needs shops.
What is more useful is the category mix. Anti-social behaviour and shoplifting concentrated around a retail parade is a very different picture from burglary spread across residential streets, even at identical totals.
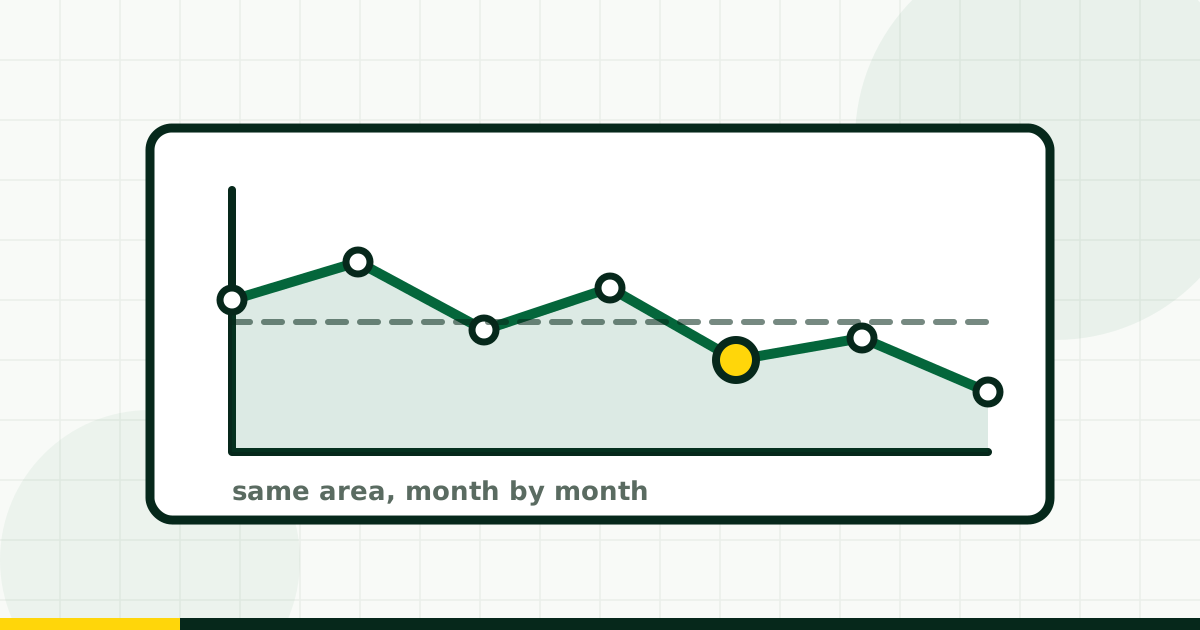
3. One month is noise, twelve months is a signal
Crime counts wobble. A single month above or below average means very little — one incident with several linked offences can move a small area’s numbers noticeably.
Look at the trend across a year. That is why our tool shows month-by-month rather than a single headline figure. Recent months are also provisional: data gets revised as investigations conclude, so the most recent month is the least settled.
4. Scotland is not missing — it is not published
If you search a Scottish postcode on our crime tool, you get a message saying it is not covered, rather than a map.
That is deliberate, and it is the choice I would defend hardest. Police.uk publishes street-level data for England, Wales and Northern Ireland. Police Scotland does not publish through that service. So we have nothing to show.
We could show an empty map. It would look consistent and it would be a lie by omission, because an empty crime map reads as “no crime”. Saying “not covered” is less tidy and considerably more honest.
The comparison trap
The most common mistake I see is comparing two postcodes on their totals and stopping there.
Recorded crime is counted where the incident happened, not where the person responsible lives, and not where the victim lives. A retail park records the shoplifting that happens in it. A station records what happens on the concourse. Neither tells you much about the streets around them.
If you are weighing two areas, compare the same categories over the same months, and look at whether the mix differs rather than whether one number is bigger. Two postcodes with identical totals can describe completely different places.
What crime data cannot tell you
Whether a street feels safe walking home at 11pm. Whether the recorded incident was a one-off. Whether the problem has been dealt with. Whether the neighbours look out for each other.
Those are the things people actually mean when they ask “is it a nice area”, and no dataset answers them. Visit at night. That is still the best available method.
Recorded crime from police.uk, covering England, Wales and Northern Ireland. Check recorded crime for a postcode.


Comments
Loading…
Comments are open to members, so every one is attached to a real account.