
Crime data is the most misread dataset in property research. The numbers are real — police.uk publishes every recorded incident — but reading them raw rewards the wrong areas and punishes the wrong ones.

Counts punish busy places
A postcode containing a retail park, a station and six pubs will record more incidents than a cul-de-sac — because more life happens there, not necessarily because your street is less safe. Shoplifting reported at a supermarket lands on the map at that supermarket. If you compare a town-centre postcode with a suburban one on raw counts, the town centre always loses, and the comparison always misleads.
The category mix matters more than the total
- Anti-social behaviour and shoplifting cluster around footfall — shops, transport, nightlife.
- Burglary and vehicle crime track residential streets — this is the category to actually study for a home move.
- Violence "in or near" a location often means the night-time economy, concentrated in a few hundred metres.
Trend beats snapshot
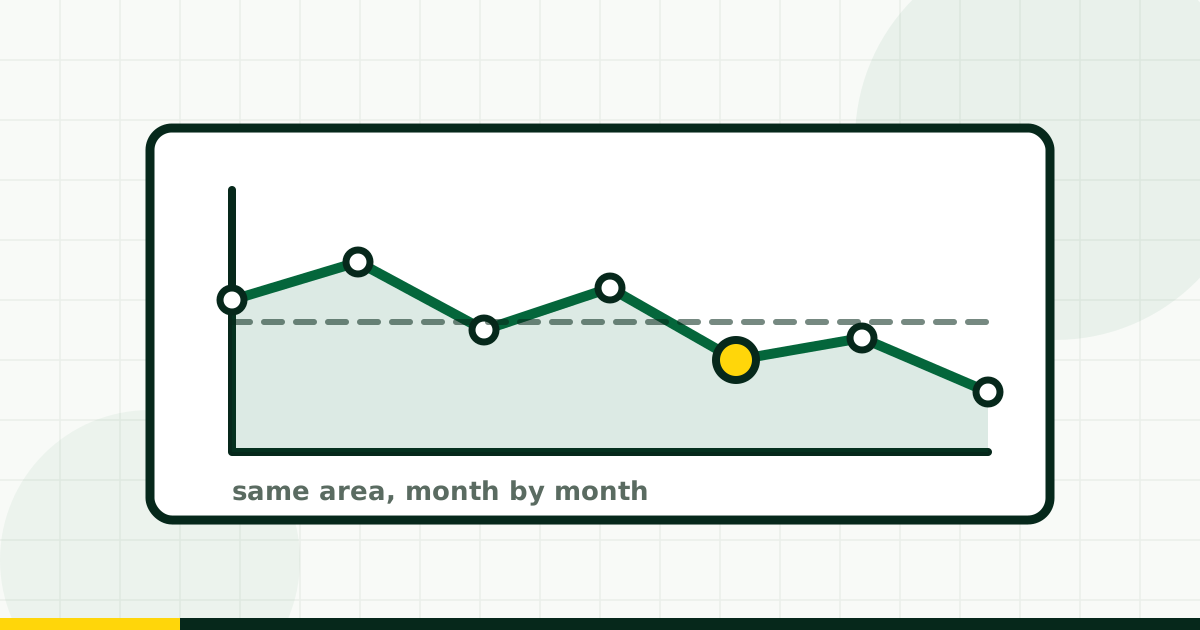
One bad month is noise; three rising years is signal. When you look at any area's figures, look at the direction over years, not the latest bar on its own.
Where MoveCompass fits
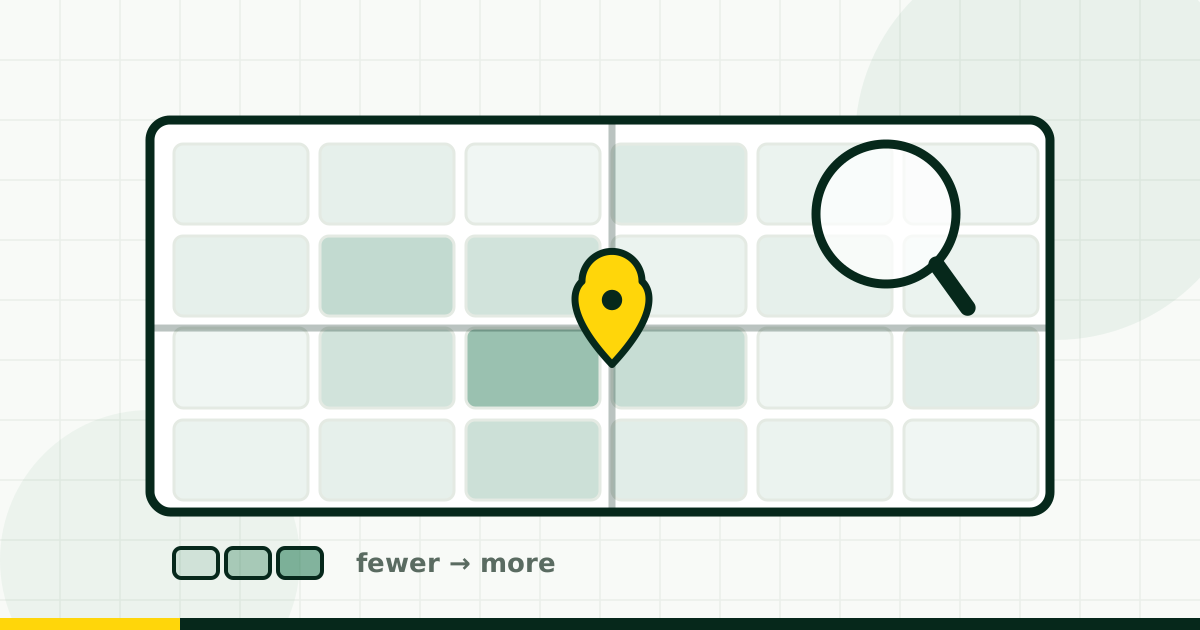
The upcoming Crime Checker maps recorded incidents by category and year for any area, using official police.uk data with its published methodology — including the honest caveat that incident locations are deliberately blurred to protect victims. Facts with their limitations attached: that's the only fair way to publish this dataset.



Comments
Loading…
Comments are open to members, so every one is attached to a real account.